UX
Zopeco


OVERVIEW
This brief aimed to use data sources to inform and engage an audience around the impact eating meat has on the environment.
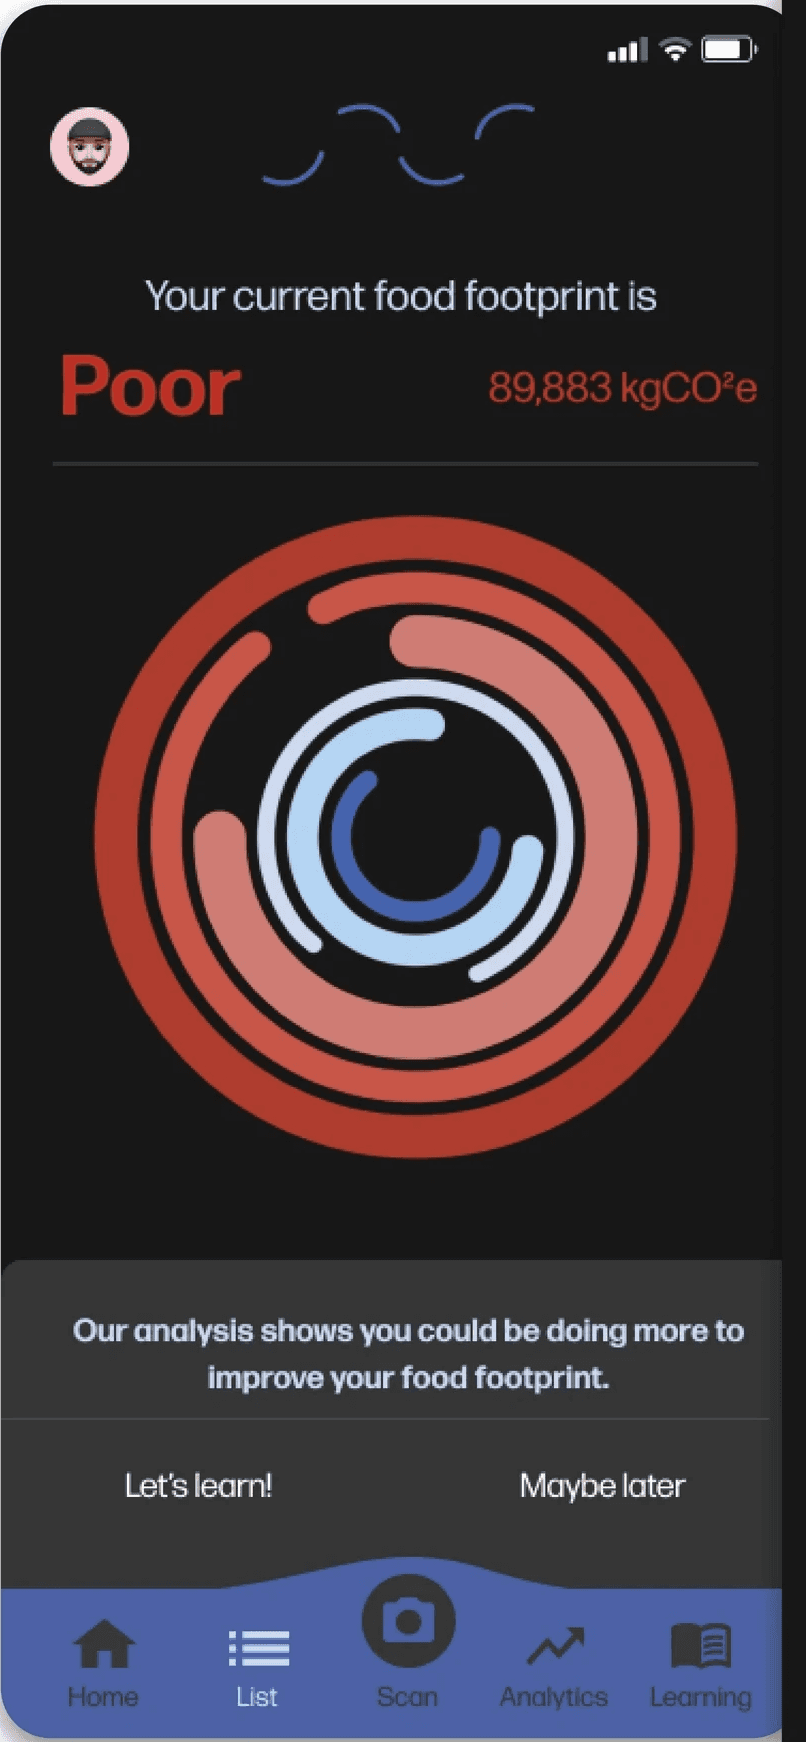
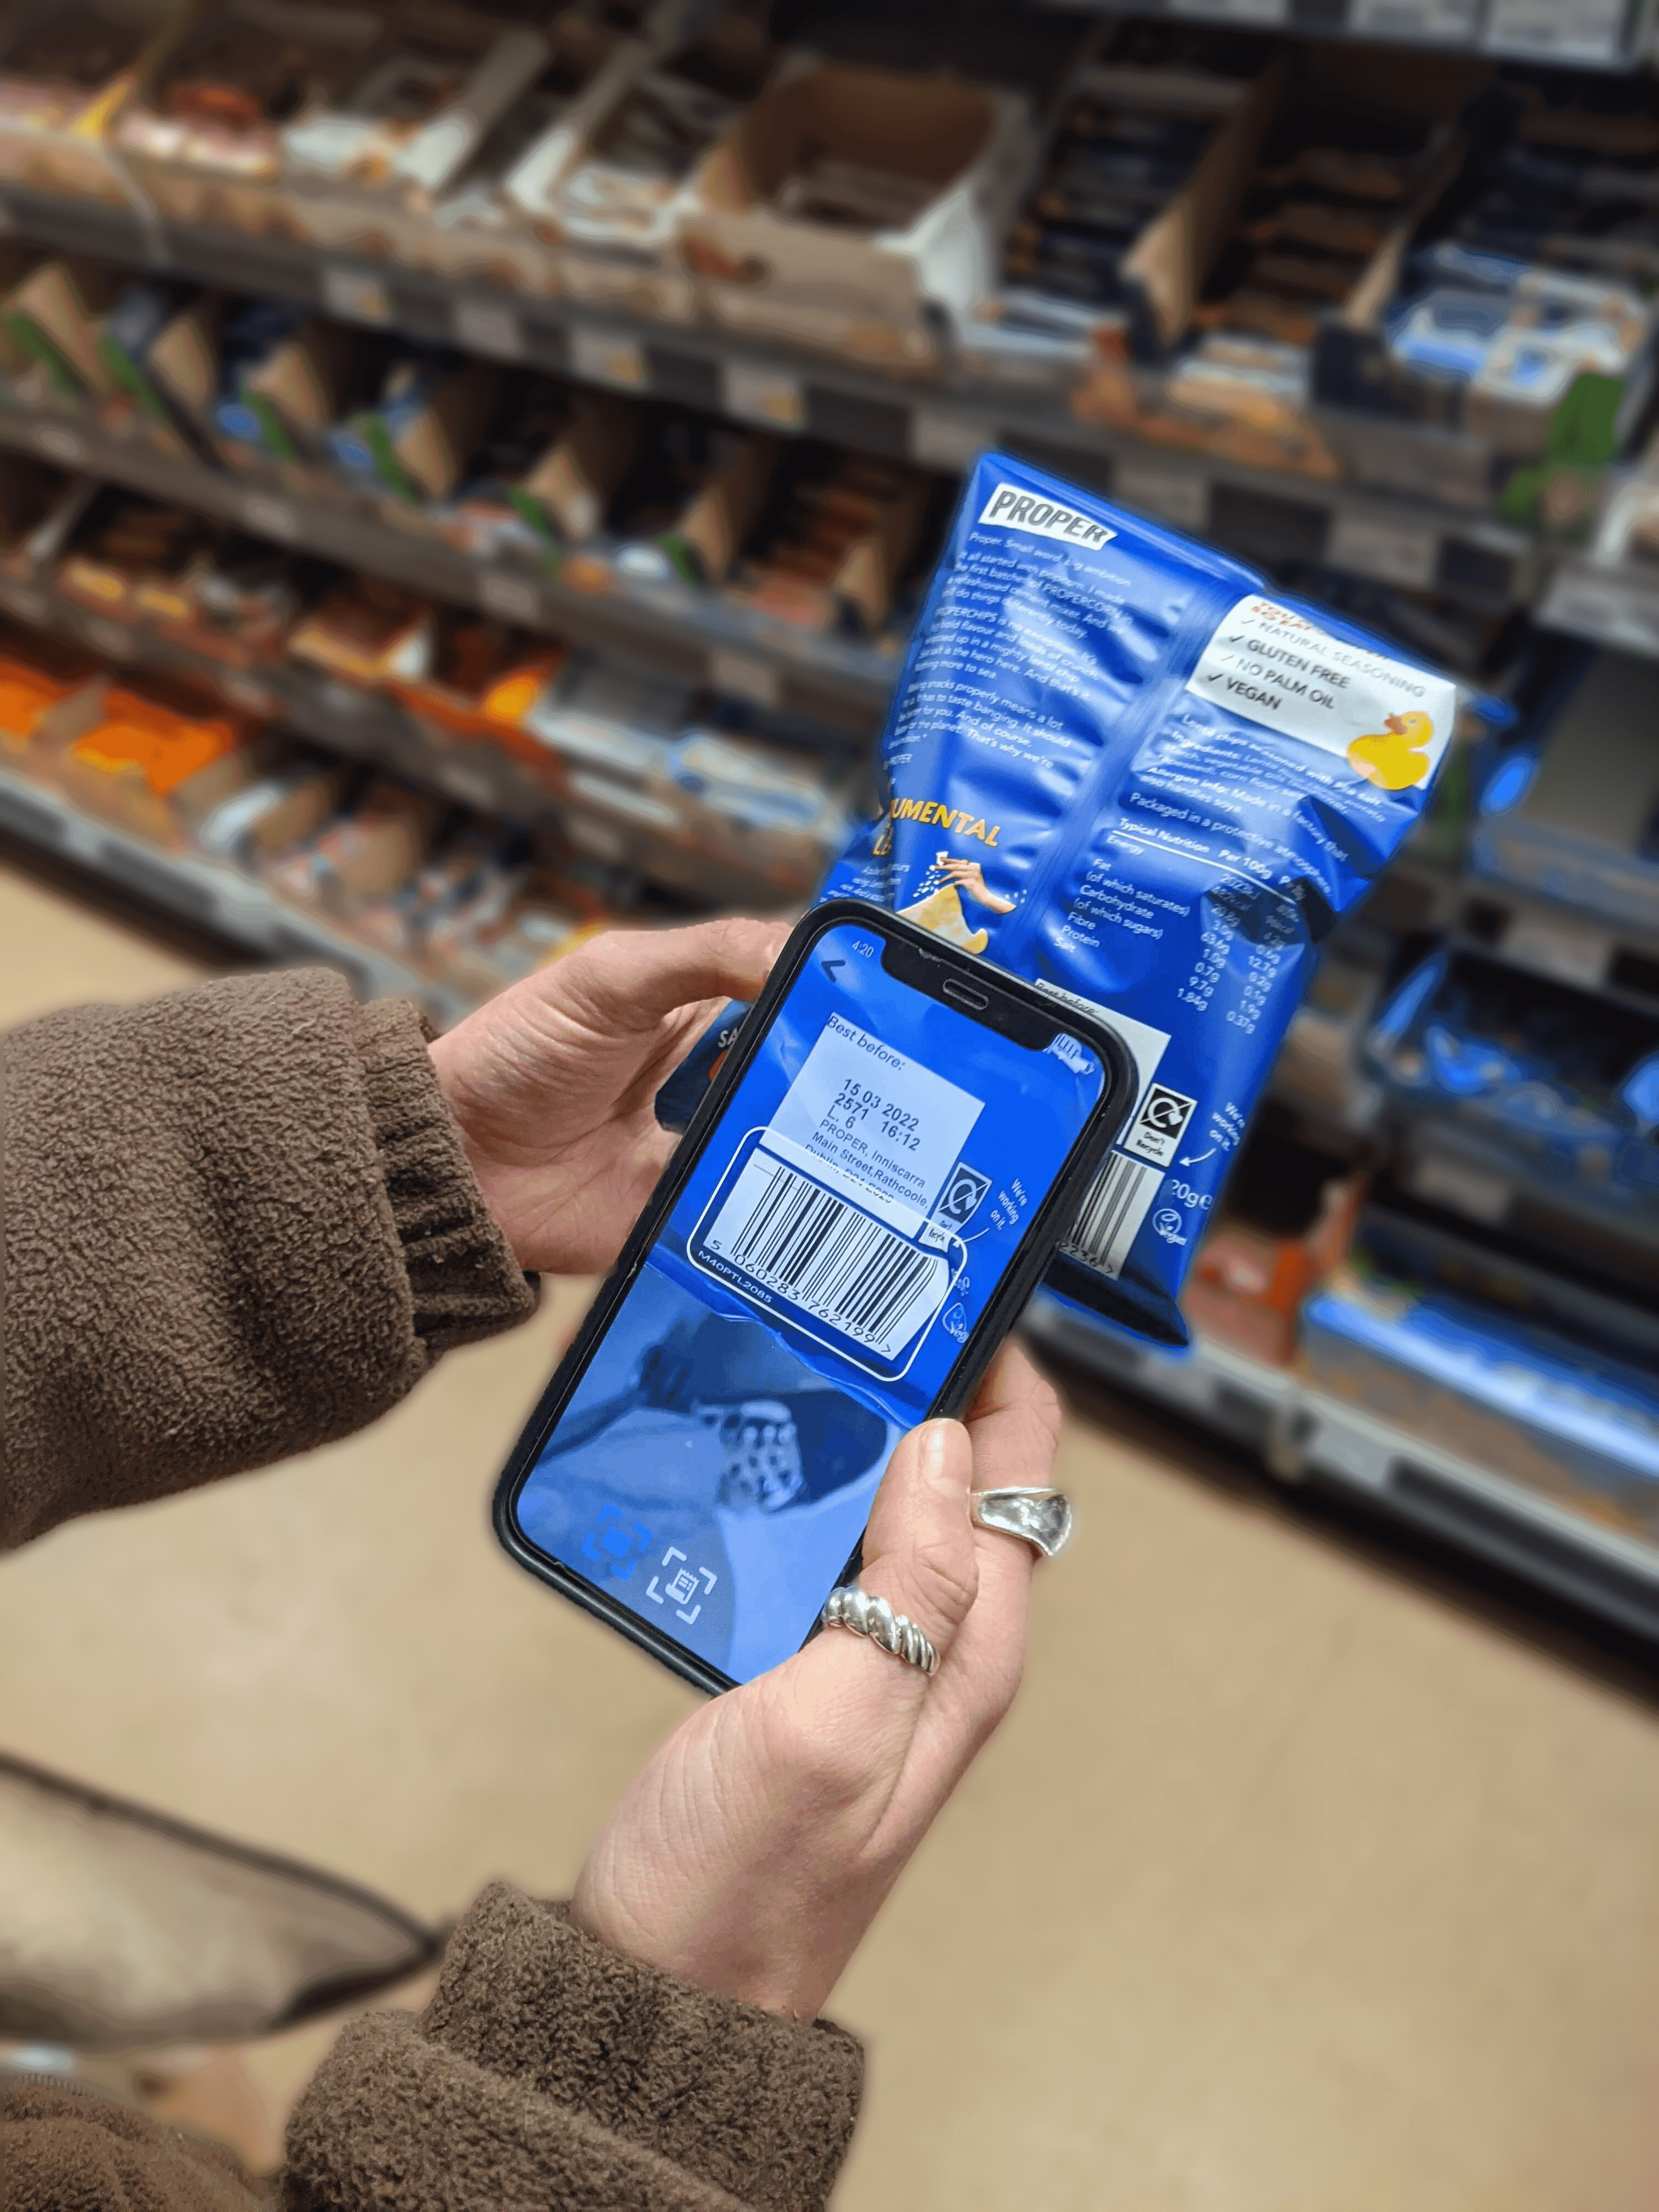
As the user shops they scan each item which ticks it off the shopping list they created in the app, they will then be told the carbon output of that product, if it is severe the app will make suggestions of alternatives. The user scans their receipt, generating a data visualisation of their food shop. The user can click on each circle to see which products gave them that result and what they could try next time instead. We knew that incentives were important in order to cause behaviour change, so when a user’s food shop shows signs of improvement and they are making better food choices, seagrass will be planted along the UK coast, which is a very efficient way of capturing carbon.
Scan Food
Carbon Ratings
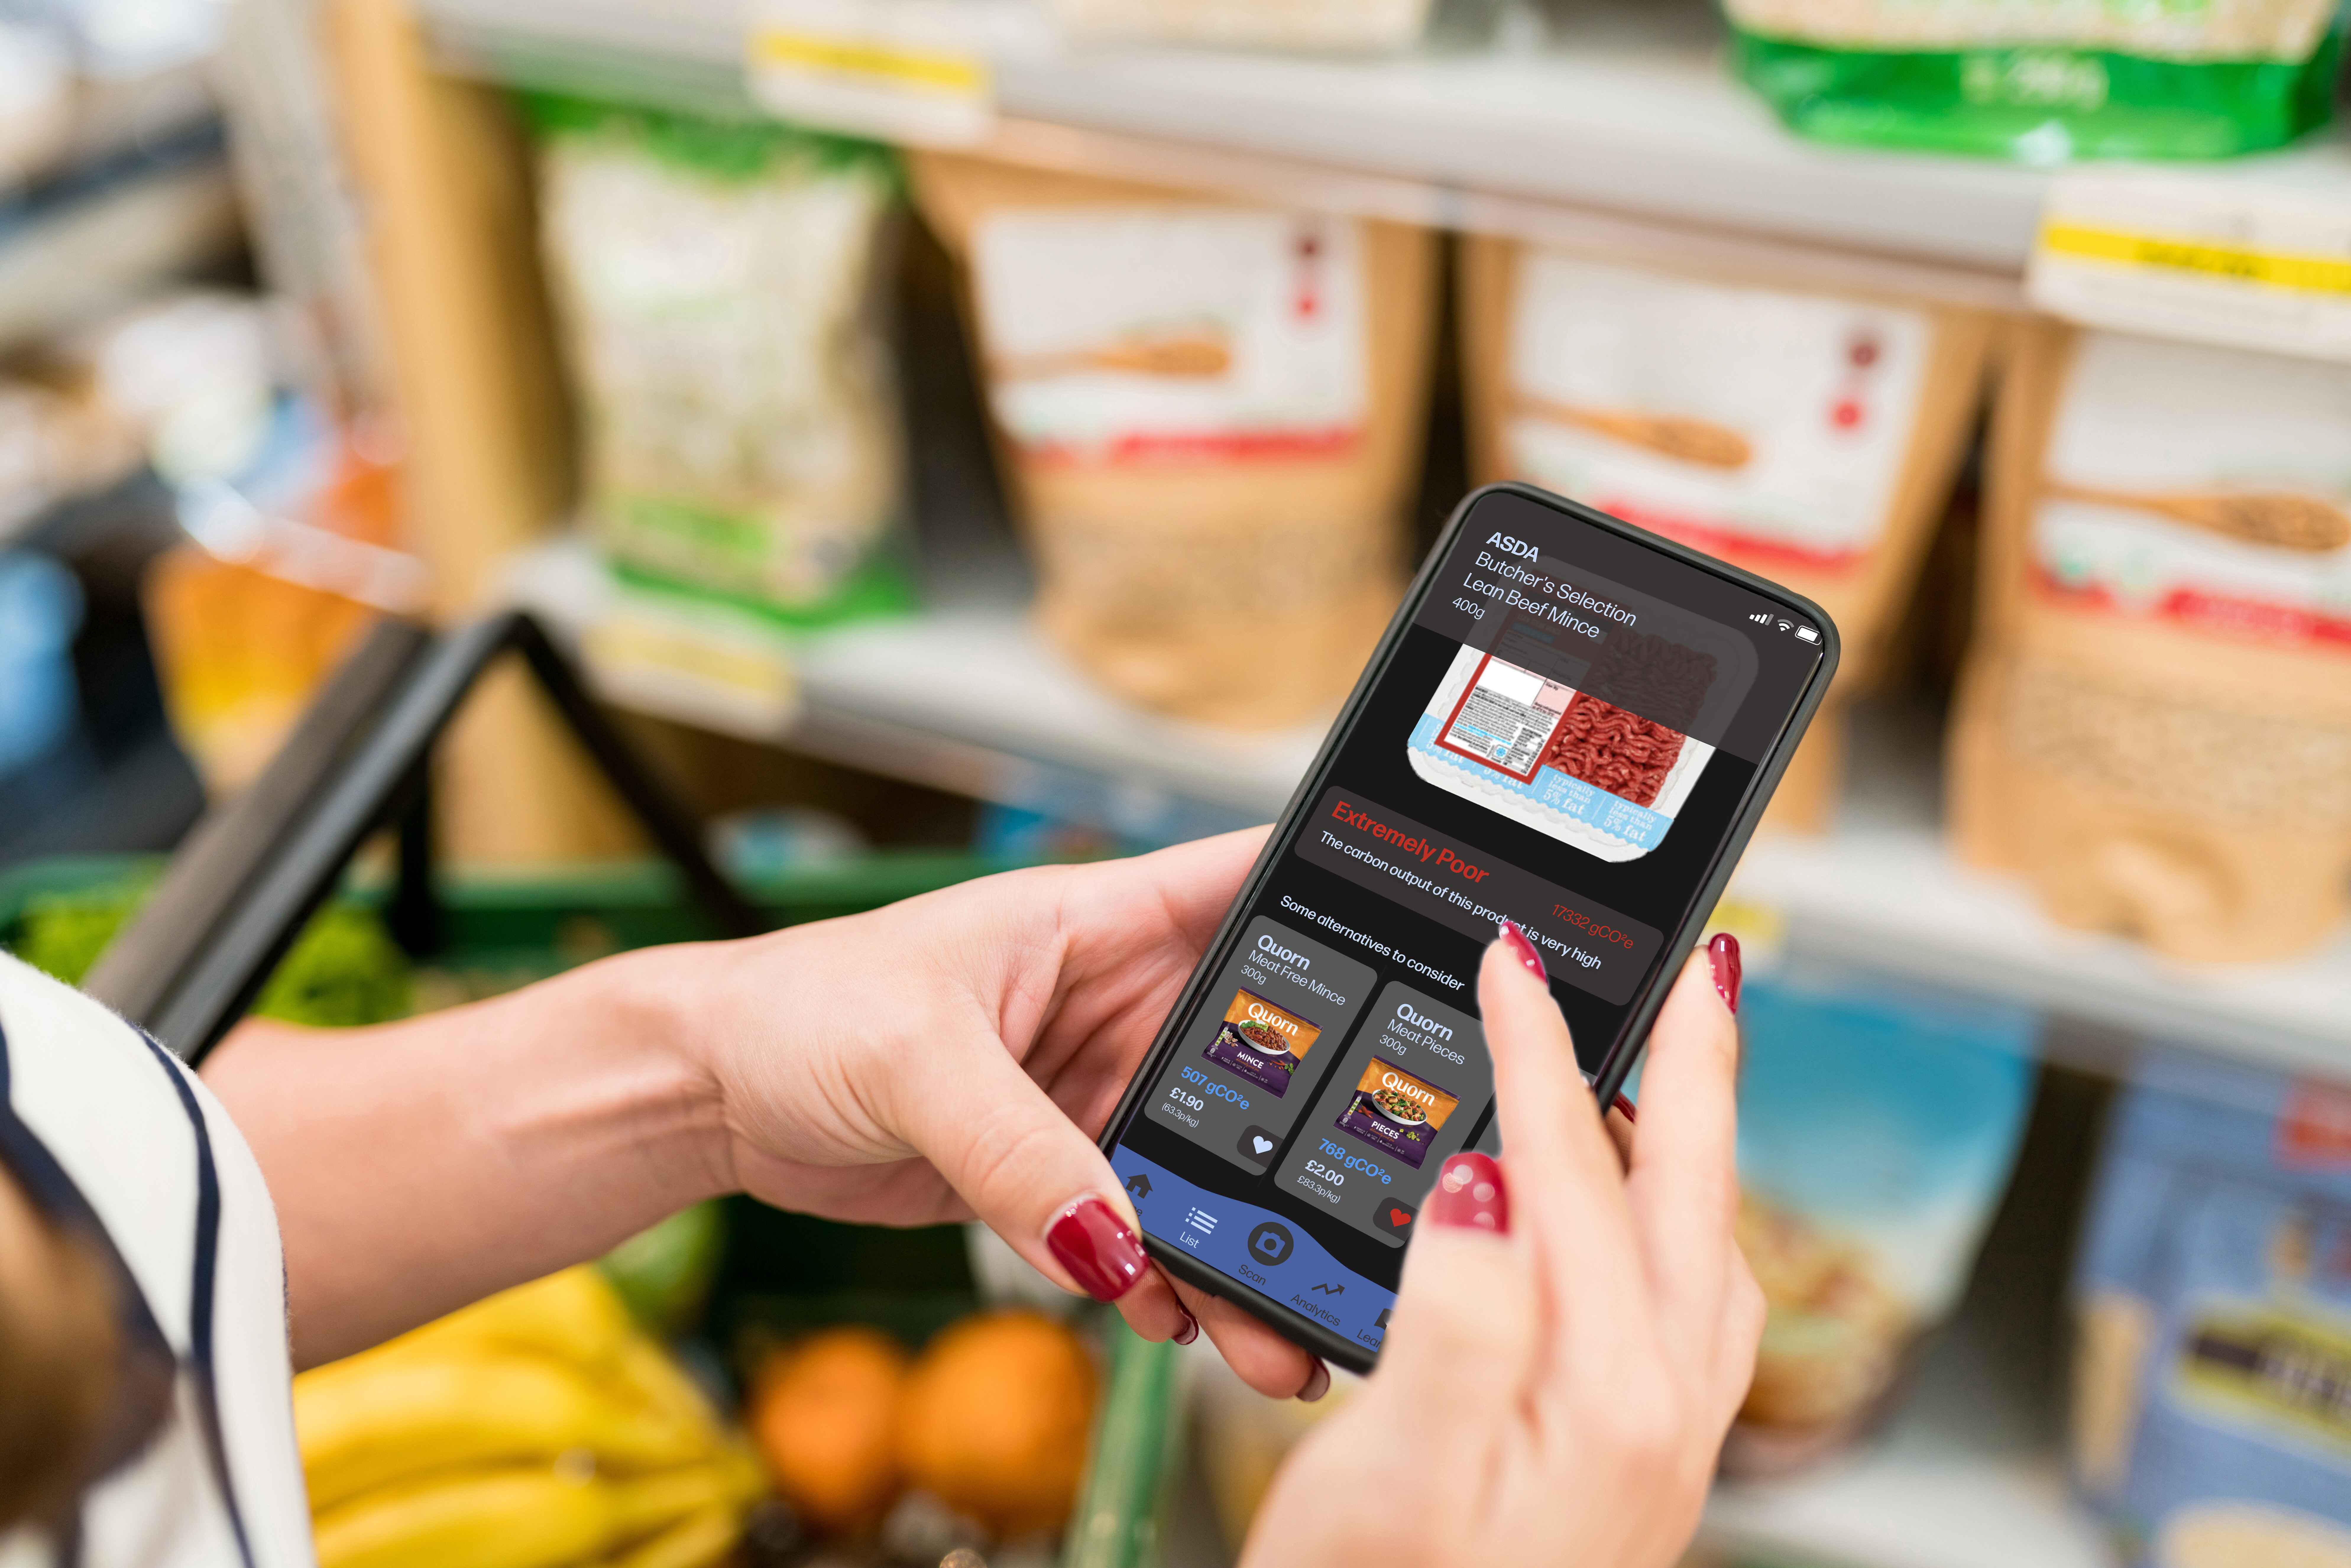
Carbon Ratings

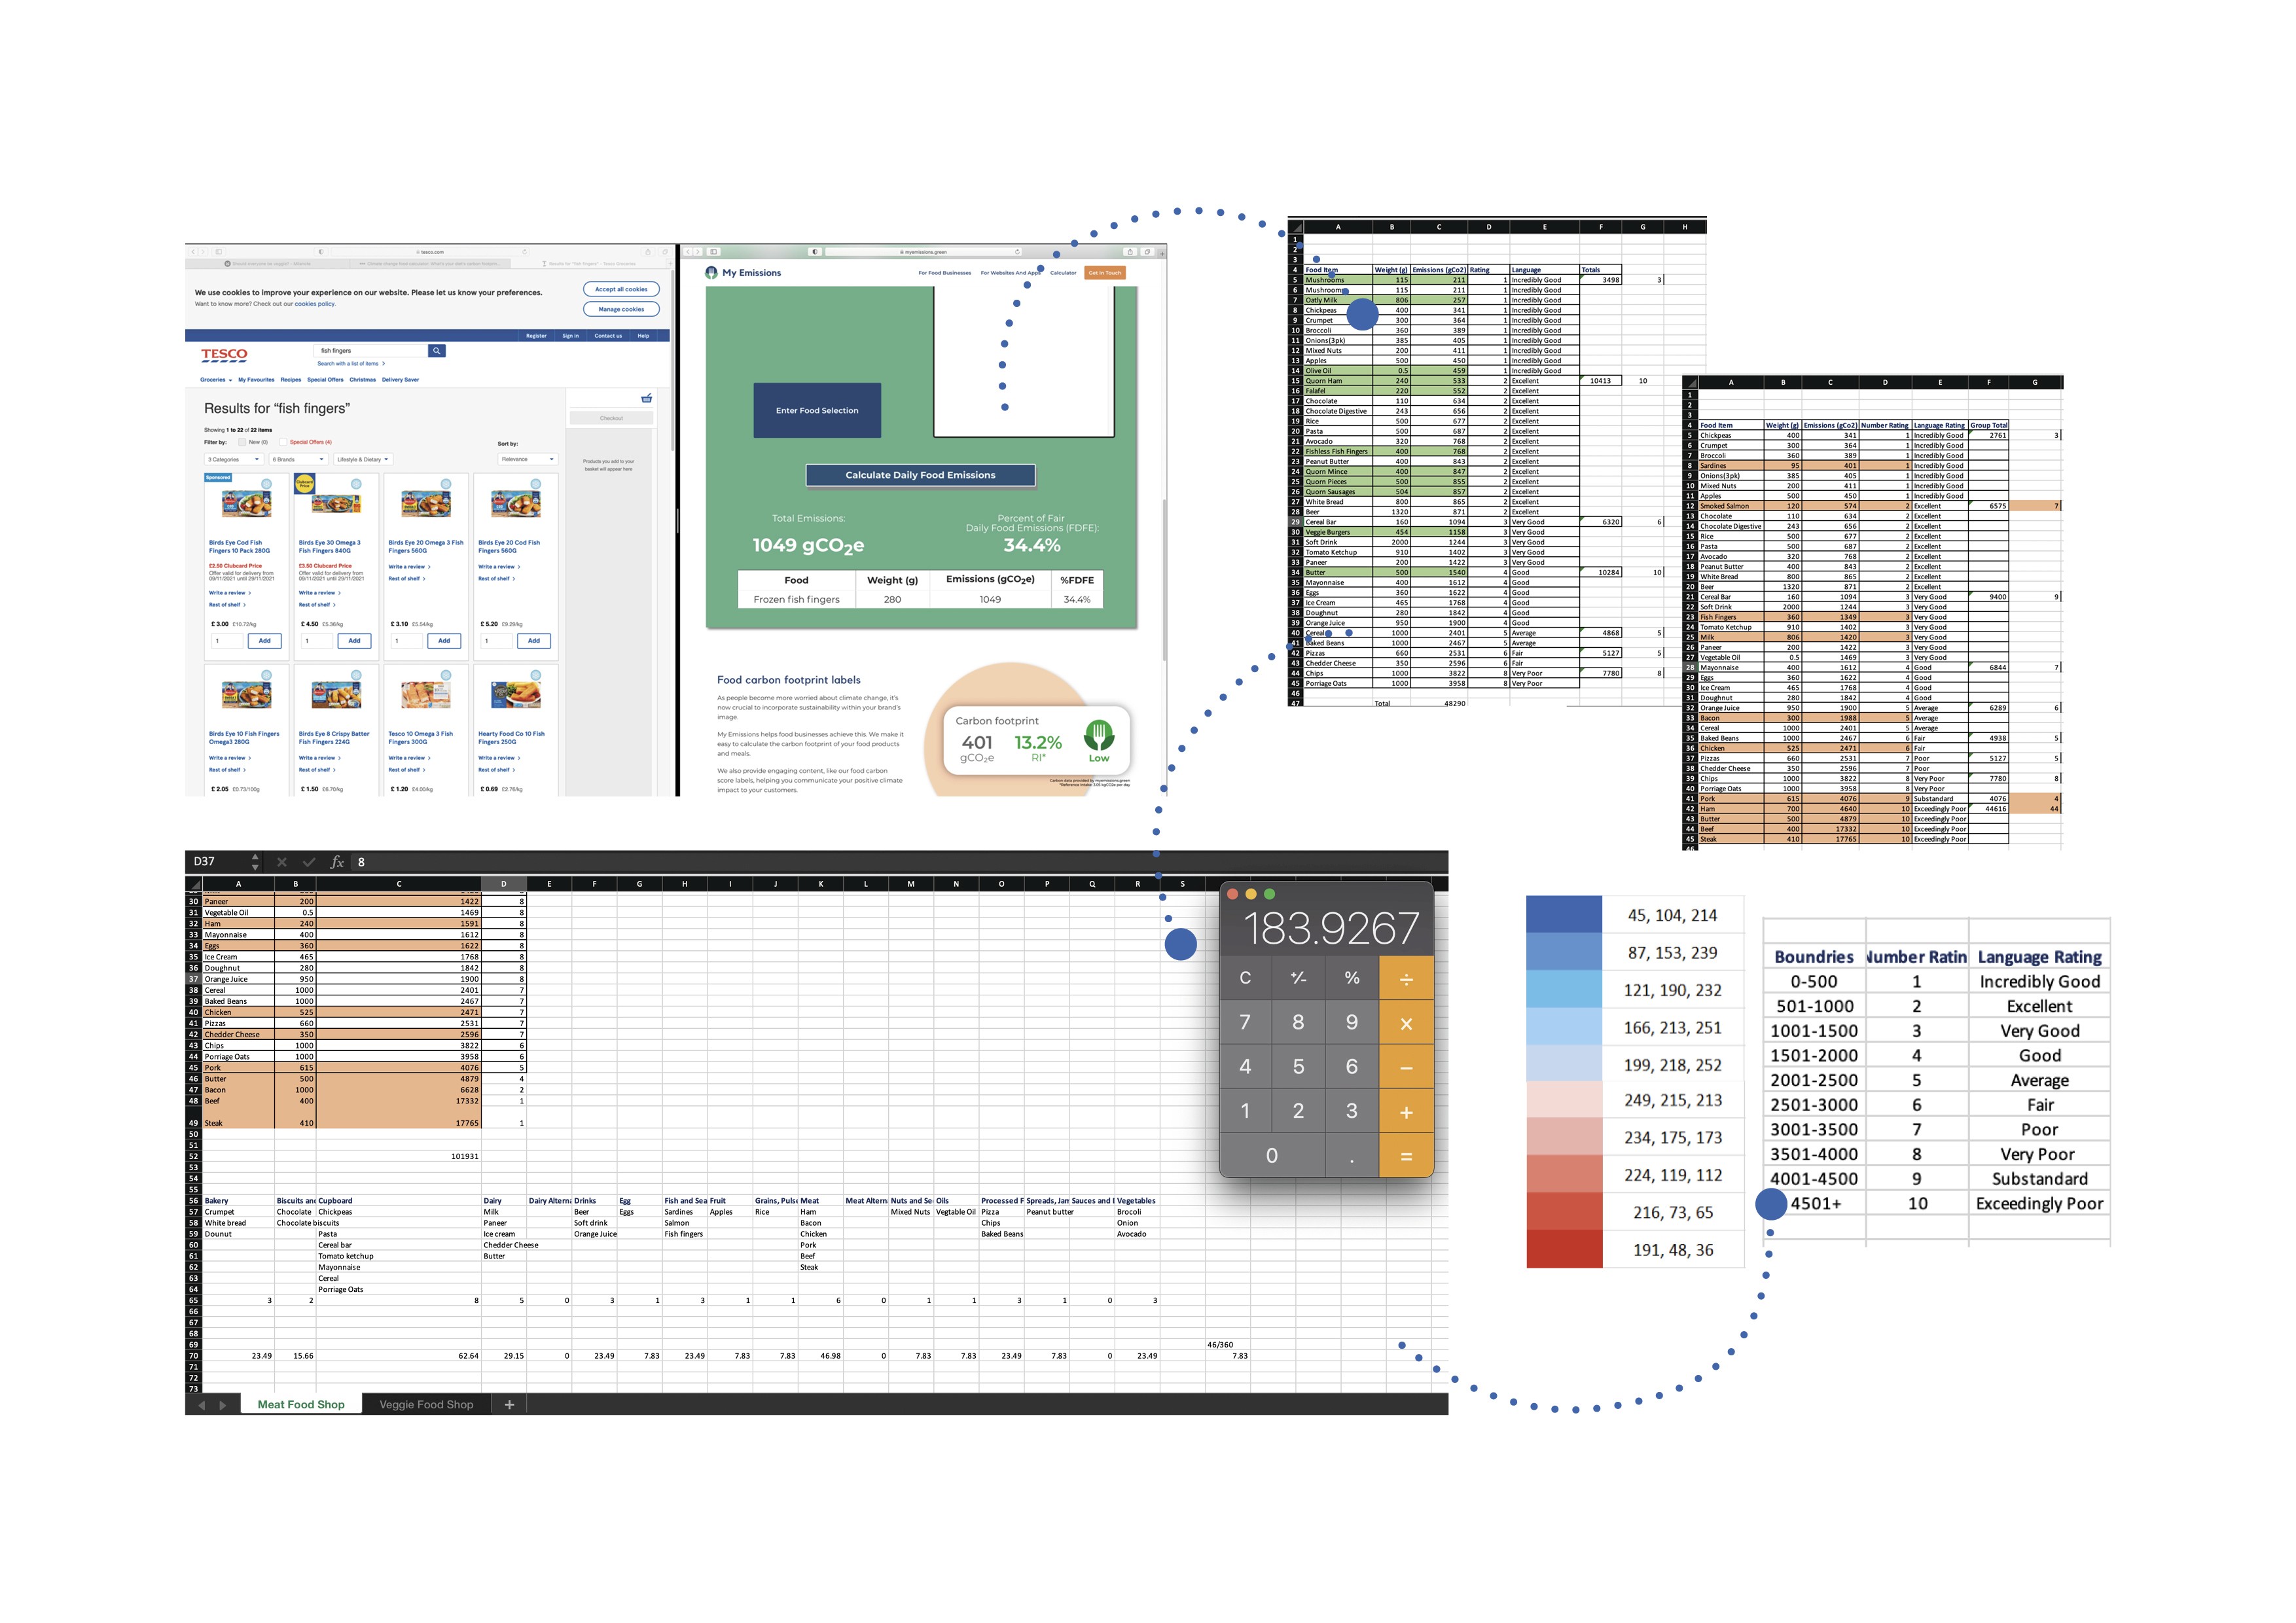
Data visualisation structure
Comparing a sample shopping list with CO2 output to create rating system.

Fidelity development
Progress from low to high fidelity.

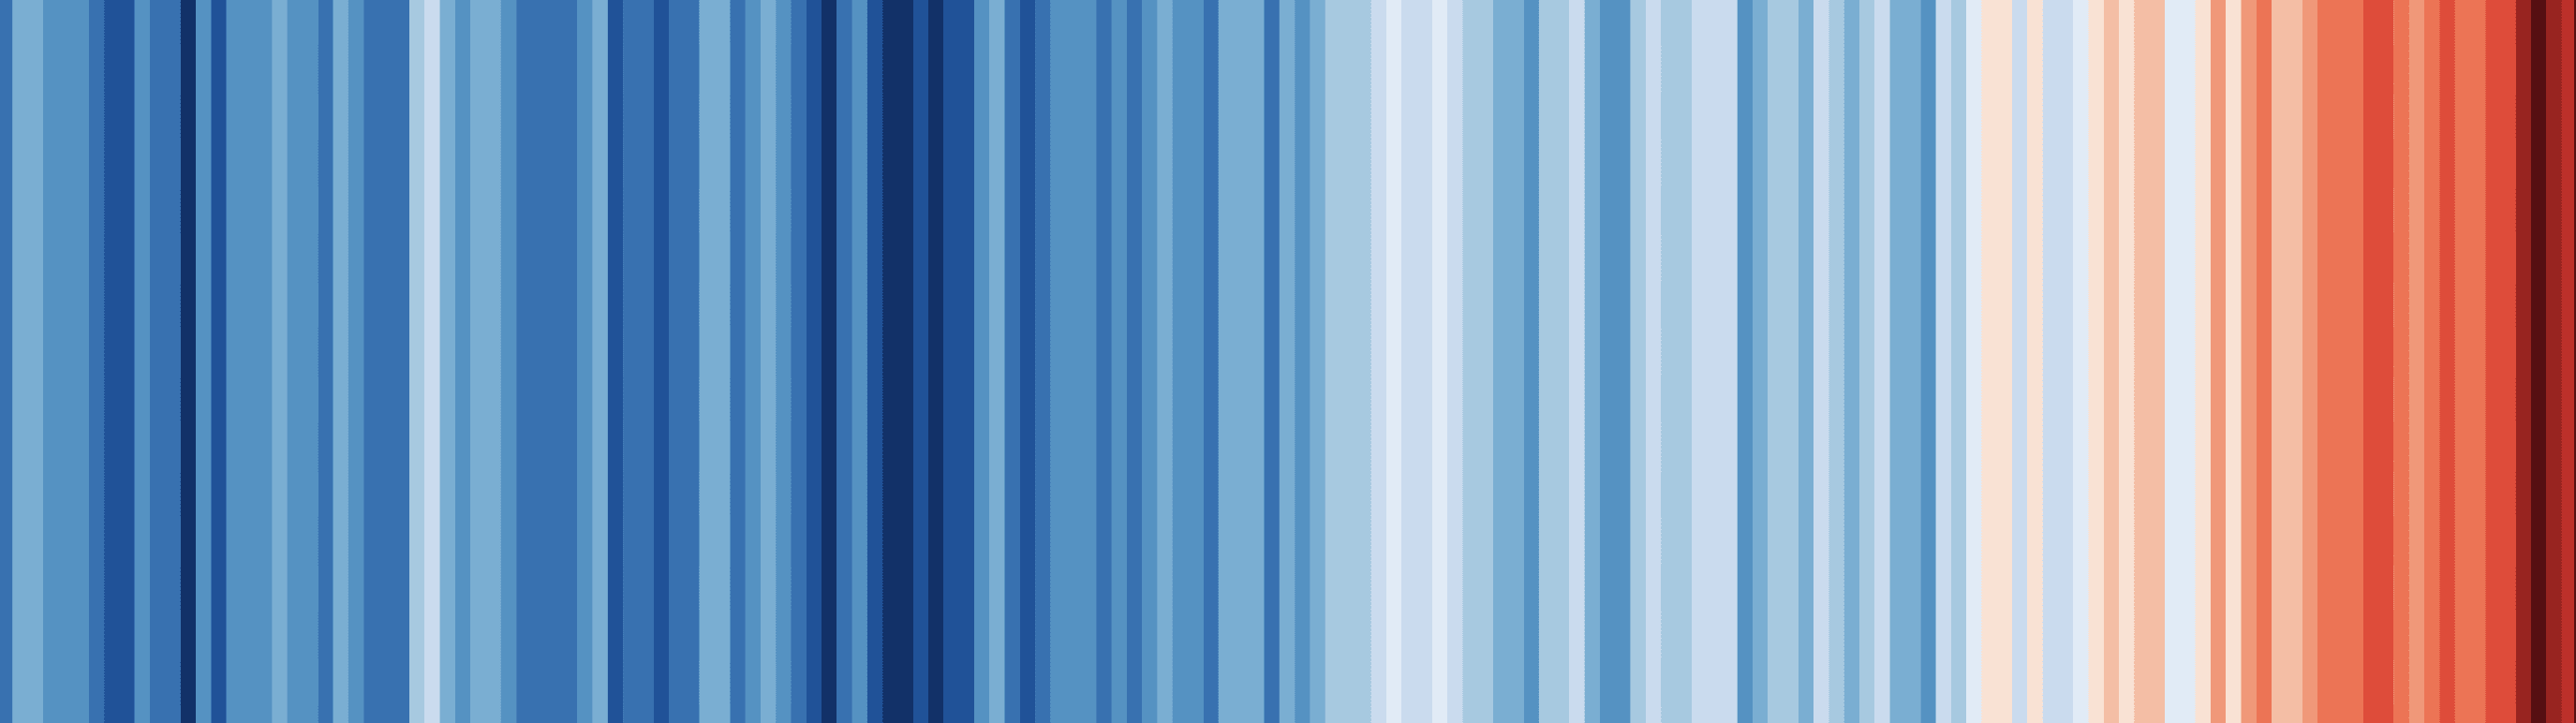
Data visualisation concept
Inspired by the the warming lines visualisation showing the temperature of the earth. A linear image, with a start and an end, I wanted mine to be a a visualisation to be the circular, sustainable driver of the app.

Data visualisation development
Testing data designs with users to ensure the visuals are clear to understand
NEXT PROJECT
CONTACT
LILY DRABBLE
2024